
Recently, my PLN colleague Roxi Thompson posed some compelling questions on LinkedIn: How do you collect data to demonstrate the impact of your coaching program? What methods have you found effective, especially in showing improvement in areas like instructional design or student learning?
As instructional coaches, these are the questions we must answer to advocate for our role and demonstrate our value. While we know our work transforms classrooms, stakeholders often need measurable evidence to connect coaching to improved teaching and learning outcomes.
One powerful way to do this is through regression analysis—a data-driven method to quantify the relationship between what we do as coaches, the strategies teachers implement, and student success. In this blog, I’ll walk you through a practical example of using regression analysis to tell this story, and I’ll share other strategies to help you align your coaching efforts with measurable student outcomes.
An exciting element to add is that a deeper discussion of what is outlined in this blog is going to be discussed in my upcoming book Crush it from the Start: 25 Tips for Instructional Coaches and Leaders, which is slated to come out in Quarter 1 or 2 of 2025. I hope you can take a look at the book once it arrives in the future!
Now, let’s dive in.
The Scenario: Coaching, EdTech Usage, and Student Performance (on assessments using that tool)
To illustrate, let’s look at a hypothetical case study. Imagine you’re coaching 30 teachers at a single school site. Each receives varying amounts of your time, and some are more proactive than others in leveraging EdTech—let’s say, the assessment platform Quizizz is the tool you were focusing your coaching on. The goal of the coaching was not only to increase the usage of Quizzizz, but also to coach teachers on integrating formative assessment as much as possible into lessons. Thus, the ultimate question is this: how do your coaching hours and their use of Quizizz impact student scores?
The Data
- Coaching Hours: The time you spend with each teacher, providing guidance and support. I like to use Connecthub.io to collect this data (and more) related to my instructional coaching work.
- Quizizz Assessments: How frequently teachers use this EdTech tool for assessments. Coaches on the admin portal on a district-issued Quizizz account can see the usage by teachers. Another way is for teachers can share with coaches their data log from the assessments they have delivered to students.
- Student Scores: The average student performance during a unit (dependent variable).
Unpacking the Regression Analysis
Using this data, I ran a regression analysis with coaching hours and Quizizz usage as the independent variables (predictors) and student scores as the dependent variable (outcome).
What Is Regression Analysis?
Regression analysis is a statistical method used to examine the relationship between one dependent variable (in this case, student scores) and one or more independent variables (coaching hours and Quizizz usage). It allows us to quantify how changes in the predictors affect the outcome, giving us insights into what drives performance.
Understanding Significance Through the p-value
An essential part of regression analysis is evaluating the p-value for each predictor. The p-value tells us whether the observed relationship is statistically significant—typically, a p-value below 0.05 indicates that the result is unlikely to have occurred by chance. For this analysis, both coaching hours and Quizizz usage had p-values under 0.05, confirming their significant impact on student performance. Reviewing p-values is critical to ensure that our conclusions are grounded in statistically meaningful data, rather than random noise.
Key Findings and Regression Plot
- Positive Correlation: Coaching hours and EdTech usage both positively impacted student performance.
- Explained Variance: The model explained 78% of the variation in student scores, demonstrating a strong connection between coaching and learning outcomes.
- Practical Insight: The analysis underscored the dual value of instructional support and targeted technology use (using Quizzizz for formative assessment).
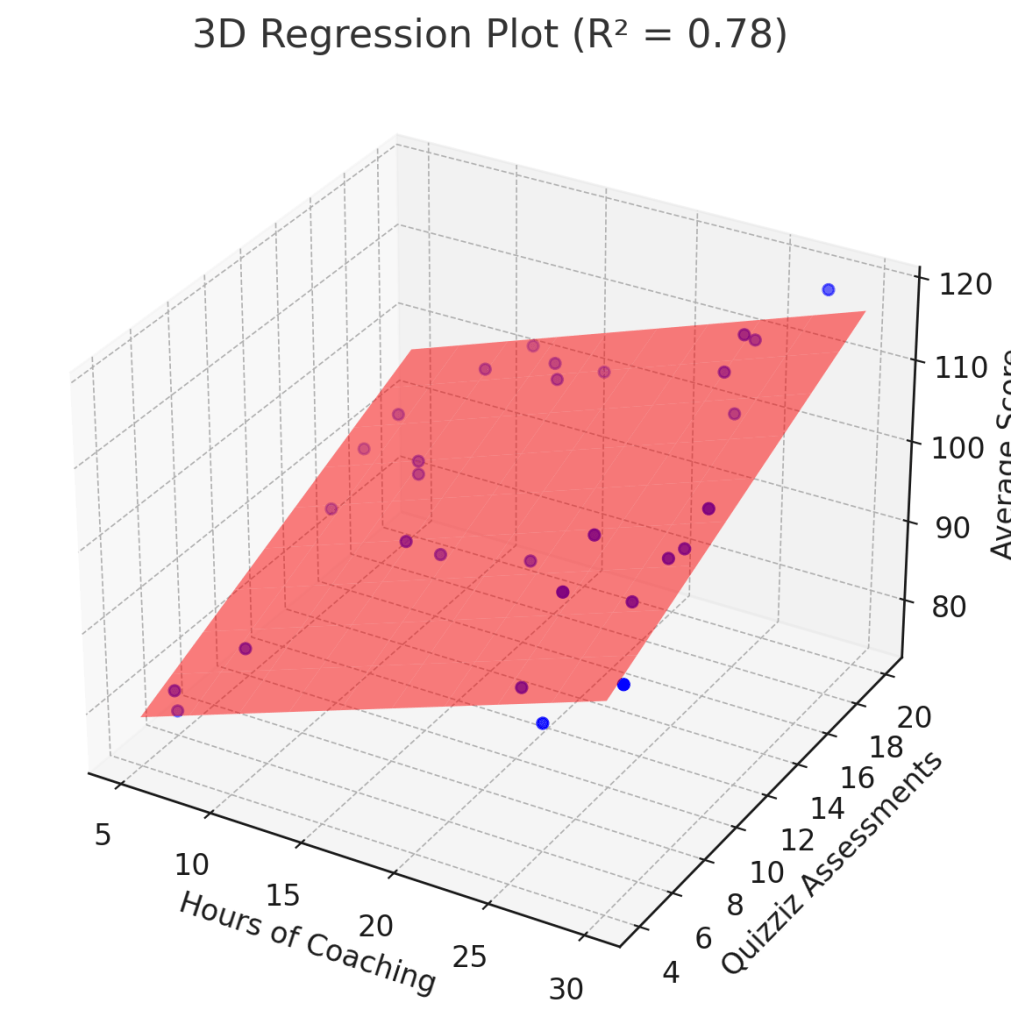
This 3D regression plot visualizes the relationship between three variables:
- Hours of Coaching (X-axis): The amount of coaching time teachers received.
- Quizizz Assessments (Y-axis): The frequency with which teachers used Quizizz for assessments.
- Average Scores (Z-axis): The average performance of students on these assessments.
The red plane in the graphic represents the regression model, which is essentially a “best fit” surface. This surface shows the predicted average student scores based on the combined effects of coaching hours and Quizizz usage.
Key Points to Interpret the Graphic
- The R² Value:
- The R² value (0.78) shown at the top indicates that 78% of the variation in student scores can be explained by coaching hours and Quizizz usage combined. This means the model provides a strong explanation of how these two factors relate to performance.
- Data Points (Blue and Purple Dots):
- Each dot represents a teacher’s data point, reflecting their coaching hours, Quizizz usage, and the resulting student scores.
- Dots closer to the red plane indicate that the model closely predicts the actual data for those teachers. Outliers (dots further away from the plane) show where the prediction may deviate.
- Slope of the Red Plane:
- The incline of the red plane along the coaching hours and Quizizz usage axes indicates the positive relationship between these predictors and student outcomes. As either coaching or Quizizz use increases, student scores generally improve.
- Practical Implication:
- Teachers with higher coaching hours and greater Quizizz usage (top-right of the plot) tend to have students with higher scores. This reinforces the idea that coaching support and consistent EdTech use are valuable investments for improving learning outcomes.
Using This Data for Coaching Programs
This plot allows instructional coaches to visually demonstrate how their efforts (hours of coaching) and specific strategies (e.g., using EdTech like Quizizz for formative assessment) contribute to measurable a degree of student success. By analyzing such a model, coaches can identify which factors have the greatest impact and use this information to refine and advocate for the implementation of various EdTech tools they have access to in their schools/districts.
What This Means for Instructional Coaches
This type of analysis does more than validate our work—it tells a story. It shows stakeholders that our efforts are not just anecdotal but backed by measurable results. By leveraging data, we can advocate for more coaching opportunities, better EdTech training, and the necessary time and resources to support educators effectively.
Here’s the magic: You don’t need to be a data scientist to do this! Tools like Excel, Google Sheets, or even AI tools like GPT-4 and Claude Sonnet 3.5 can help you conduct this analysis in just a few steps.
Other Data Analysis Strategies for Coaches
While regression analysis is compelling, there are several other ways to analyze and present the impact of your coaching:
- Growth Over Time: Use pre- and post-assessment data to compare student performance before and after teachers receive coaching support.
- Action-Research Surveys: Create teacher self-assessments before and after coaching to measure changes in their confidence, strategies, or skills.
- EdTech Adoption Rates: Track how frequently teachers incorporate tools like Quizizz, Canvas, or Curipod etc. after specific coaching sessions.
- Teacher Retention Data: Analyze whether coaching efforts correlate with higher teacher retention or improved morale.
- Qualitative Data Analysis: Use focus groups or interviews to gather teacher testimonials about how coaching improved their practice. Use coding thematic coding methodologies to identify common themes.
- Triangulated Data: Combine qualitative data (teacher feedback), process data (frequency of coaching sessions), and outcome data (student performance) to present a holistic view of your impact.
Practical Tips for Getting Started
- Collect Reliable Data: Keep detailed records of your coaching hours, teacher activities, and student outcomes.
- Choose Accessible Tools: Start with familiar platforms like Excel or Sheets to place all of your data.
- Engage in Collaborative Analysis: Partner with data coordinators or district leaders to refine your analysis and insights.
- Share Your Results Strategically: Use dashboards, reports, or presentations to show stakeholders the clear connection between coaching and success.
Moving Forward
Instructional coaching is often the unsung hero in improving instruction, student outcomes, and teacher retention. Furthermore, by using data-driven methods like regression analysis and other strategies, we can make our value undeniable and share it with stakeholders. The key is to connect what we do as coaches to what matters most—student learning and teacher growth.
Now it’s your turn: How are you using data to tell your coaching story?

Leave a comment